INTRO
This is the fun page of this site, designed for readers who like “action” and those who desire to capture additional gains from active trading. In this section we’ll explain our trading strategy and show few examples, but trading ideas and trading alerts of trades we execute will be posted daily in the main section.
ABOUT OUR TRADING STRATEGY
There are almost infinite number of trading strategies and every trader has his / her’s own unique style of trading. There are short term traders, scalper traders, day traders, momentum traders, pullback traders, breakout traders, swing traders and many others who have adopted a trading style which fits best their personality and time engagement density.
Our preferred style is swing trading that captures shorter to intermediate trend cycles spanning from few weeks to few months time. Swing trading is an appropriate style for those who (like us) do not like to stare at the computer 10h a day and make hundreds of trades per month, plus we do not have any edge over much faster and nimble programatic high frequency traders which are dominating day-trading space.
TRADING APPROACH
Our sweet-spot in trading is to exploit opportunities around the “exhaustion or extreme” levels of a minor and intermediate time frame swings. We avoid intraday swings as they are highly influenced / manipulated by high frequency traders (HFTs).
In order to identify tradable “exhaustion” areas with favourable risk:reward opportunity we are primarily using Elliot Wave counts and Fibonacci retracement & extension measurements to 1) develop our own picture of the wave cycle structure and 2) to determine most favourable entry and exit points. Elliot waves and Fibonacci tools help us develop useful framework to gauge where in the expanding or contracting cycle we might be in, and when the cycle is exhausted and ready to turn around. Also, we believe Elliot waves can provide a good framework for investors to “pivot” quickly if they are wrong in their original market analysis and hypotheses about the next market move.
Trading is a psychology game, with the best reward:risk opportunities at it’s extremes – when “crowd” is extremely euphoric or extremely pessimistic. Typically and the end of contracting cycle or at the end of expanding cycle the crowd is the most fearful or most euphoric. Hence if traders are able to “measure” the level of euphoria and fear through the lenses of price movements, they can successfully navigate through bullish and bearish trends being most of the time on the “right side” of the trade.
Check the following 2 examples:

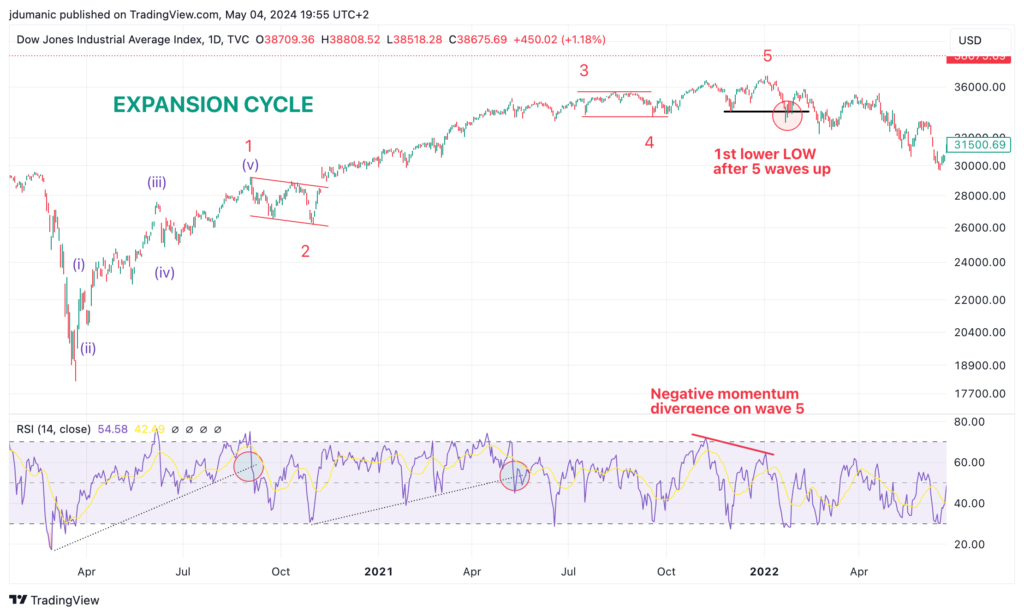
Check out this bull cycle from Covid low. First notice how the entire cycle is broken down in 5 waves and notice how RSI momentum is fading in wave 5 signalling the major trend change. In the following section we will explain how Elliot wave traders would interpret crowd psychology (fear and greed stages) just from observing price movements and relative strength index, and how would they position their trades relative to the wave count. Let’s go step by step through this bull cycle and let’s see how it played out:
End of Covid bear market (March 2020): Extreme fear is in the Market, everyone is running to save havens, large daly and weekly price drops, the world economy stopped and stocks are collapsing. This particular LOW was hard to spot, because it did not follow classical ABC corrective structure, hence most Elliot wave traders would miss this entry opportunity (most likely).
Wave 1: this wave stage started when FED “pivoted” and started the unprecedented stimulus of Quantitative Easing (QE) cycle. The entire stage was driven mostly by institutions who also “pivoted” on the spot together with the FED, the reset of the general “crowd” was still “hiding” in fear. Elliot wave traders (even if they did not participate in this stage – wave 1) would notice something “interesting in the price charts. They would notice 5 small bullish sub waves (purple) in the larger wave 1 (red), which would be an early hint for them that the new bull cycle might be under way.
Wave 2: wave 2 started in September 2020, and this is THE wave all Elliot wave traders would watch and examine carefully. If they would see only 3 waves down from the top of wave 1, and if they would see “symmetry” between A and C legs, they would be all over that trade. Some of them would enter immediately on the C-leg low (at symmetrical level relative to A-leg), and some would wait for confirmation and would enter on the top trendline breakout in expectation of large wave 3. At the upper trendline breakout, it is a clear signal to Elliot wave traders that we should have at least 2 more highs in this new bull cycle.
Wave 3: was no “brainer” for anyone any more, except the scared retail investors. At this wave majority of general public realised we might be in the new bull cycle, so they “jumped” on board with the rest of traders and and pushed the market to the wave 3 top. Between wave 2 and 3 there are plenty of smaller 3-wave corrections which are all trading opportunities for “pullback traders”.
Wave 4: is typically shallow corrective wave which attracts “late comers” (dumb money) to join the party on a dip for the final 5th wave. At this stage, most of the “smart money” (institutions) are dumping their holdings to retail customers and they are “locking in” big gains and starting to de-risk for the final stage of the bull cycle.
Wave 5: always comes with RSI divergence, and it is the 1st warning sign to Elliot wave traders we might be in the final innings of this cycle. This is where they start preparing to exit and lock in gains as well. But calling the exact top is always tricky, because divergence can go on for a while before the final breakdown, so Elliot wave traders would look for additional evidence before pulling the trigger, and the final piece of evidence comes with 1st lower low, which signals the trend change is about to start.
Now let’s explore the “Corrective Cycles” below:

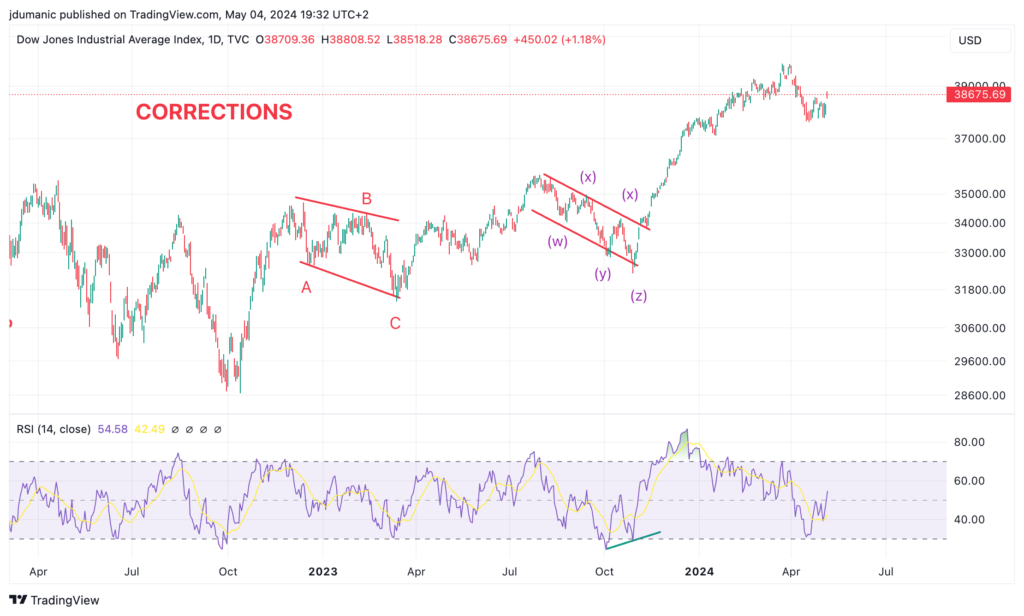
Dow Jones Industrials demonstrate very clearly 2 different “corrective animals”, one easy to spot and trade, and the other one difficult to trade.
Most equity (indices) pullbacks are developed in easy to spot ABC format, where A&C legs are symmetrical which can be successfully exploited by “pullback traders”. By the way, this is one of our favourite trading set-up (see below). The other type of corrections are more difficult to trade (like the one in wyz format in purple) and it’s more difficult to catch the “beginning” of the new cycle (especially if z-leg is not equal to y-leg). Nonetheless by understanding the “corrective structures” traders would still have plenty of opportunities to jump on the swing trade when the price finally broke out of the downtrending channel.
CONCLUSION:
We believe Elliot wave structure can provide a very good framework for traders to explain the market cycle stages and prepare traders to develop bullish or bearish hypotheses with more confidence. Based on these hypotheses traders can then develop more aggressive or more conservative strategies which helps them improve risk:reward probabilities. We use Elliot wave structure to develop our trading plan and to decide where and when we should be looking for long or short opportunities.
TRADING SETUPS
Depending on our view of Elliot wave count we’ll be looking for different type of trading setups. Normally we’ll be looking to enter “long” trades during waves 1, 3 and 5, and we’ll stay neutral or short during wave 2 and 4 (we’ll use these corrective waves to load up our favourite instruments). At the late stage of wave 5 we’ll be looking to enter into short / hedge position not only to make money on trading but also to protect our core portfolio holdings. The following are out favourite trading setups:
PULBACK TRADING IN BULLISH CYCLES
THE LOGIC: Our logic for “pullback trading” is simple. If an instrument is in strong bull wave, such instrument will attract many investors on a “pullback” who (1) missed the bullish train early on and (2) it will attract current investors who are not happy with their “position size”.
Hence, once the security actually makes a meaningful pullback (unless we are dealing with Black Swan event like Covid), there is almost a guaranteed pool investors who are willing to jump in and buy that security “at the discount”. This “liquidity pool” will help “pullback traders” to almost “instantly” get a tail wind behind their investment and get an opportunity to lock in a risk-free ride.
PULLBACK TRADING STEPS. Our process for Pullback trades goes like this:
- Find strong bullish trending security (trend is confirmed by Elliot wave bullish count 1,2,3,4,5, a,b,c, 1,2,3,4,5 etc.)
- Wait for a 3 wave pullback and go long (ideally if A and C legs are symmetrical and if C leg ends up between 0.382 and 0.618 Fibonacci retracement from the start of the trend)
- Adjust Stops at the breakeven point after the the initial price reaction and this will complete the 1st part of the trade process.
- Second part of the trading process is to decide where we want to exit the trade. Sometimes we’ll run our trades on a “short leash” if we believe we are approaching the final wave 5 top, sometimes we’ll let our zero-risk trades run for a very long time if we are comfortable with an idea that we are early in the next bull cycle. In either case this is a comfortable stage for traders because even if we are wrong in our assumptions and the price turns down again, we’ll get out at breakeven point without any losses.

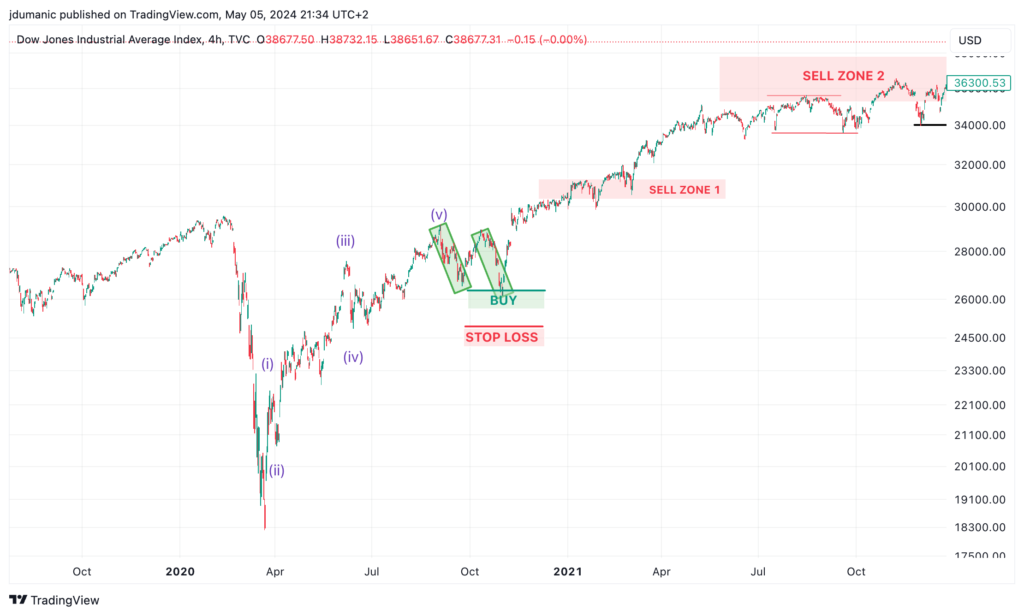
Let’s break down this “pullback trade” in key components.
- Bullish setup: After a large price drop (-38%), price rebounded strongly (+59%) in 5 sub waves in an impulsive fashion.
- Corrective wave 2: Corrective wave was very clean ABC retracement with symmetrical A&C legs. Symmetrical leg point will be the 1st price point which will attract many traders. This is also where we like to jump in on a “pullback” trade.
- Buy trigger: as explained above we set up our buy trigger at the “symmetrical” A=C leg price level (green BUY line). At the same time we set up Stop Loss at the 1.618 extension of the A leg to minimise potential losses if we’re wrong.
- Secure zero-risk trading position: once the price reacts (in this example you see that price reacted exactly at the symmetrical price point where C leg equal to A leg) and breaks the C-leg trendline (price breaks the green box of C-leg), move the Stop Loss to the entry price point and secure zero-risk trading position. At this point you have all the upside and zero downside, which is very comfortable position for traders.
- Exiting the trade: There are 2 logical trading exit positions in this case. In bull markets once an instrument has completed it’s pullback phase, the next minor resistance is in most cases at 1.618 extension of the “corrective ABC pullback” leg (see sell zone 1 above). The second logical exit is 1.618 extension of the entire 1-2 wave (see sell zone 2 above). Traders with shorter time horizon will take profits at sell zone 1, others with longer time horizon will wait for sell zone 2 or they will take partial profits at Zone 1 and the rest of the profits they will take out at the Zone 2.
EXTREME FEAR TRADES
Every now and than, the Market will go through “extreme amount of fear” and there will be a “fire sale” on all assets. These are the times where we like to take a “counter fear” trades if we believe the Market is over exaggerating.
So, how do we “know” if the Market is over exaggerating or not? Actually we don’t know if the Market is exaggerating or not, but there are number of indicators which can help us paint the more accurate picture about the “fear” level baked into the market price. Our primary tool for that is TRIN and VIX term structure.
TRIN measures the difference between Advance / Decline Volumes vs Advance / Decline number of stocks. If TRIN shoots over 2, it means that relative selling “volume” is drying up and the statistical chance of immediate reversal is over 90% at that point.
Vix term structure compares the expectation of market volatility over the next 30 days with the expectation of market volatility of the next month out. If market pros are not so concerned with volatility with longer duration contracts (VIX:VXV >1), the current fear level is most likely overblown and we’ll take the counter fear trade.

TRIN and VIX term structure indicators are not “bullet proof” but they are highly reliable indicators of spotting the near by bottoms.
Green vertical lines indicate areas where we saw almost immediate price reversal, while red vertical lines point out to areas where price drop had a short pause and than resumed it’s downtrend soon after. Black vertical line is the area where price continued dropping but it did reverse soon after.
HEDGE TRADES
Towards the end of any Elliot wave cycle (especially after intermediate and primary wave cycles which can correct SPX prices by 15%, 20% or more and Tech prices by +30-50%), we like to take Hedge Trades not only to profit from the trade but also to hedge a portion of our Long Term Portfolio holdings.
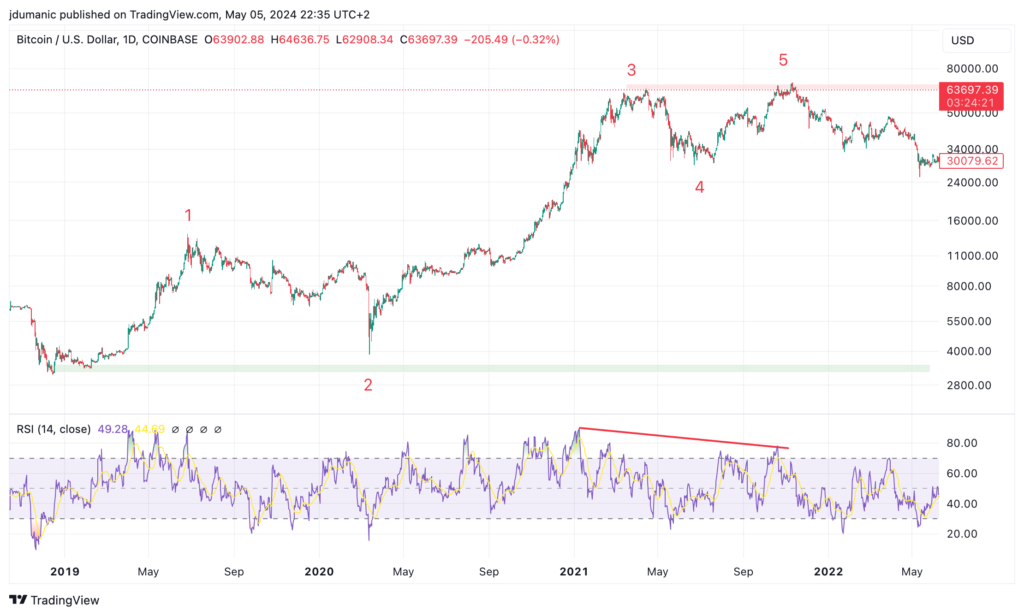
Wave 5 also always exhibit RSI divergence which is one of the early warnings we are approaching the end of the cycle. Divergences of course can last for a long time, so the divergence itself is not a trade trigger. However, an RSI divergence, RSI trend line breakdown, 5 subwaves completing the top, and the price breakdown bellow the near pivot price is most likely a toxic cocktail which rewards corrective price behaviour more than price advance behaviour.

In the Bitcoin example above, from the 2019 bottom we can observe clear 4 waves, and now we are clearly in the 5th wave in late 2021. RSI is massively diverging in this wave 5 and the price is hitting the resistance level from wave 3 top.
Naturally at this point you expect the price of Bitcoin to break the wave 3 top, but you are also aware the bitcoin price surged +1.900% from the previous major low, and you also know that 5th waves often truncate (they don’t reach their final target levels), so as an investor you want to protect yourself in case wave 5 falls short of it’s expectation and if price drops will start erasing some of your gains.
If you combine RSI massive divergence warning sign with the big resistance level at 5th final move up, it pays off to enter a hedge trade to protect agains price drops and lock in the previous gains. If Bitcoin price stays bellow the resistance level, investors want to stay hedged to protect gains, and if Bitcoin breaks decisively the resistance level, investors can close the hedge and let their holdings run further up.
As tops are extremely hard to pick, we will not outlay a precise formula how to trade this kind of trades, rather we’ll display our trades and our logic as they evolve along the way. Please check out the main area of the website for Hedge Trade posts in real time.

